Markets Exit Q1 on a High Note Amid War Jitters. What About Q2?S&P 500 🔻 4.6%, Nasdaq 🔻 7.1%, Dow Jones 🔻 3.6%
It's January. Economic growth is accelerating, the Federal Reserve looks ready to cut rates further, the AI boom still has runway. The mood is genuinely good.
Then, on February 28, the United States and Israel launched strikes on Iran, and the moo

The best trades require research, then commitment.
Get started for free$0 forever, no credit card needed

Scott "Kidd" PoteetPolaris Dawn astronaut

Where the world does markets
Join 100 million traders and investors taking the future into their own hands.

Bitcoin RoadmapToday, I want to share with you a mid-term outlook on Bitcoin ( BINANCE:BTCUSDT ) by analyzing it in a higher time frame—specifically, a 6-hour time frame—which could trigger a bullish move for Bitcoin, so stay with me.
In general, financial market movements over the past month have been heavily i

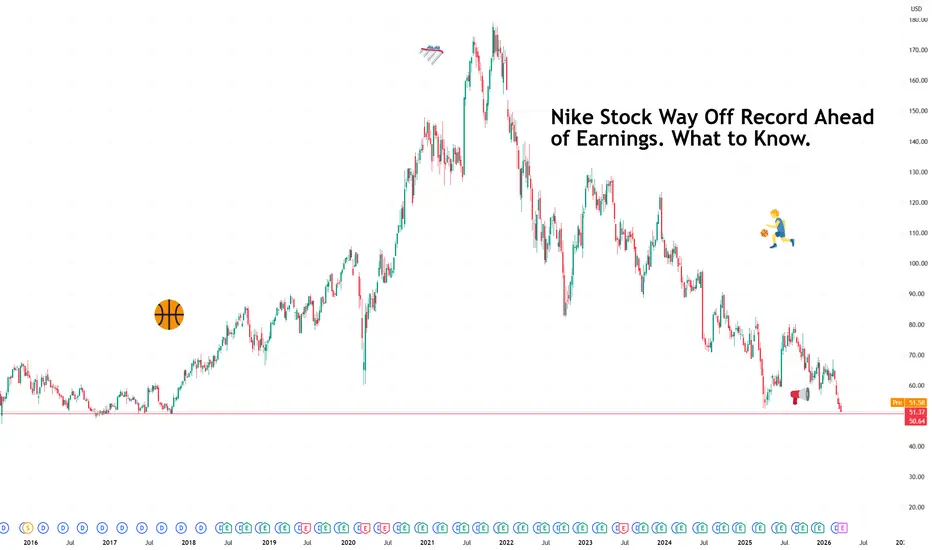
Nike Stock Way Off Record Ahead of Earnings. What to Know.There is a particular kind of corporate humbling that comes not from collapse but from irrelevance creeping in at the edges.
Nike NYSE:NKE is still the world's largest sportswear brand, still moving tens of billions in revenue, still on the feet of more athletes than any other company on earth.
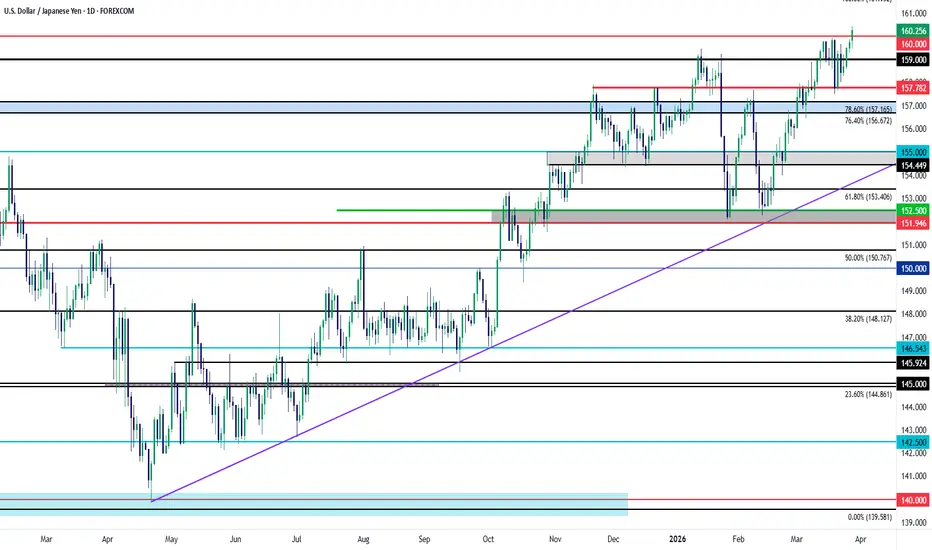
USD/JPY: The 160.00 TestFor the first time since July of 2024 USD/JPY has pushed above the 160.00 handle.
The move hit around 1am Tokyo time so we could still see a response from Japanese policymakers around the Sunday open, and interestingly, last week began with another threat of intervention that brought pullback to US
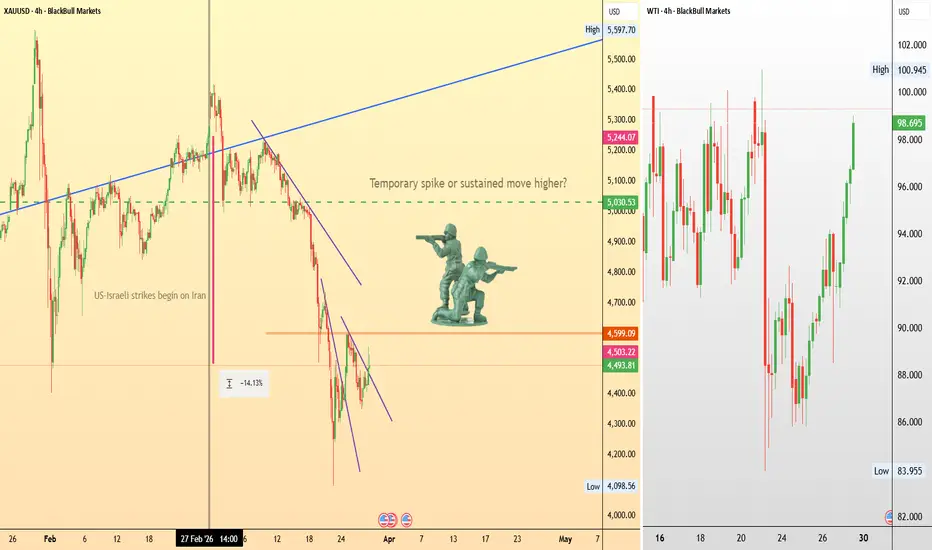
Will a ground invasion finally move gold?From a technical perspective, gold is currently in a clear short-term downtrend following the initial geopolitical spike. Gold appears to be waiting for a stronger catalyst.
Are ground troops what gold needs to start moving upward?
Iran has claimed it could mobilise more than 1 million troops to
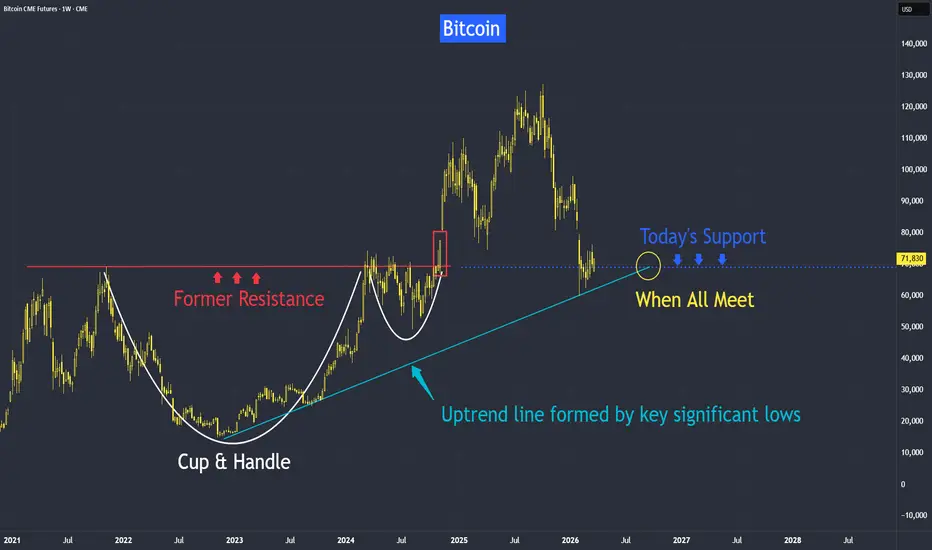
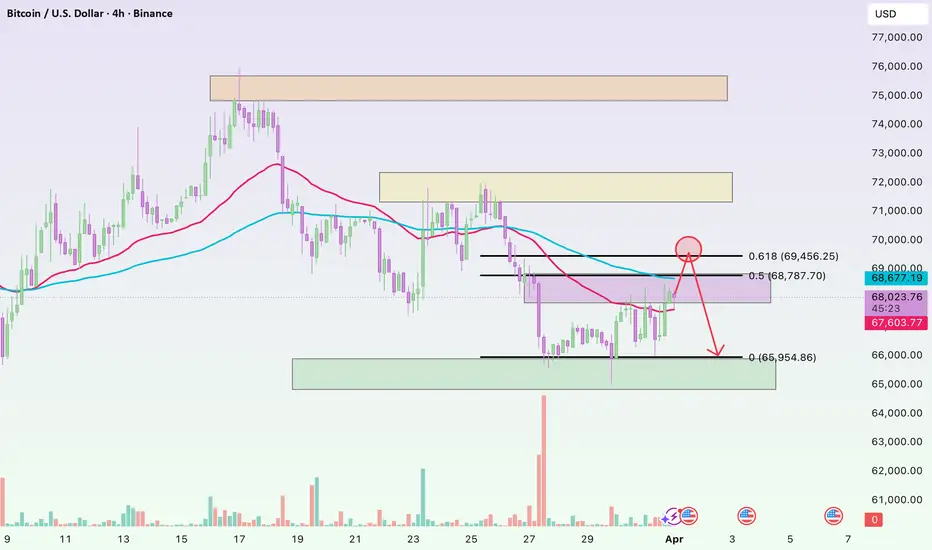
Bitcoin Key Support Level at 70,000It has fallen from last year's highs, but technical support could be near, and also supported by several fundamental factors.
Let me first touch on two key fundamentals before covering the technical aspects.
1) Regulator creating a friendlier environment - with new SEC rules and upcoming legislati
Silver Analysis: Which Direction Is Next?Before anything else, it’s important to note that silver, unlike gold, tends to have sharp and aggressive corrective moves. This makes it a bit more challenging to trade, so proper risk management and caution are essential when dealing with it.
From the point where we placed the red arrow on the ch

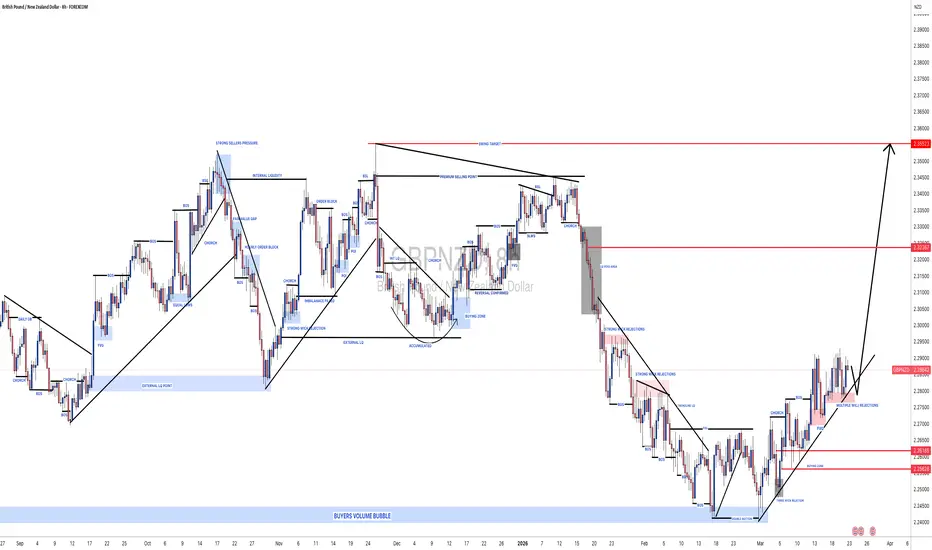
#GBPNZD: Two Targets, Once Strong Bullish Entry! ✴️ The GBP/NZD pair demonstrated a favourable reversal upon reaching our designated buying zone at 2.256, currently trading at 2.287. This indicates potential for continued upward momentum. We anticipate the price may advance towards the 2.32 level where a liquidity void is expected to be addressed.
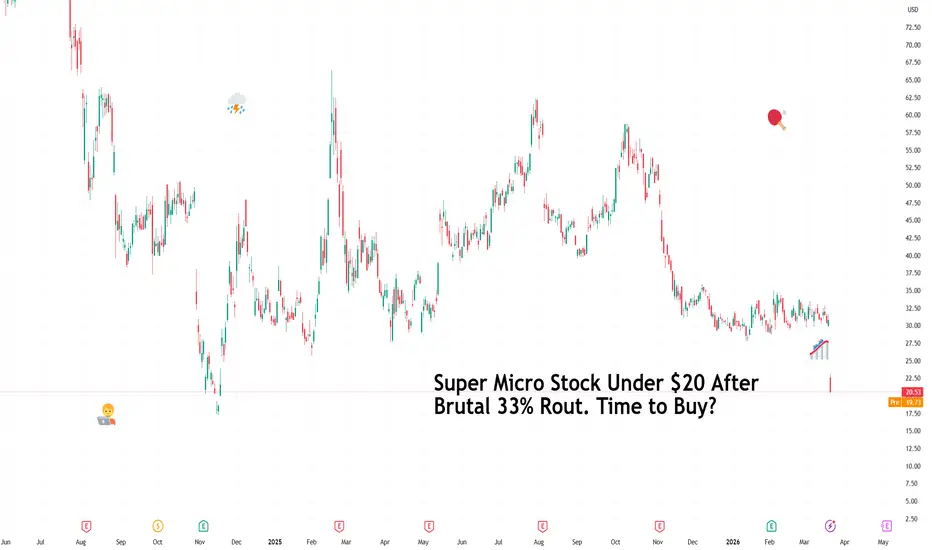
Super Micro Stock Under $20 After Brutal 33% Rout. Time to Buy?If only there was a way to track where things went wrong.
The board of directors at Super Micro NASDAQ:SMCI got together one day in the boardroom and decided it’s a good idea to bring back the same executive who had already resigned once over an accounting scandal.
They voted to hire him as a
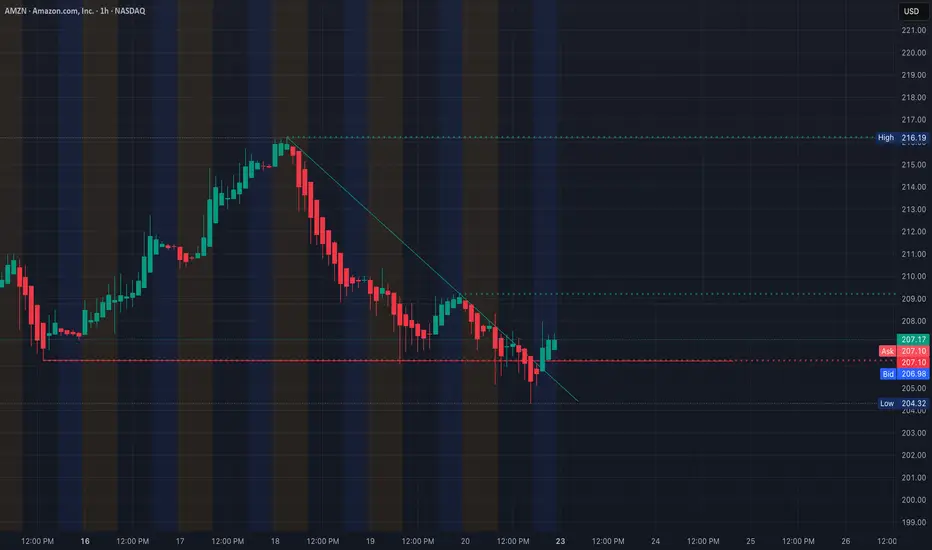
AMZN Holding Range - Waiting for Direction. Mar. 23Looking at AMZN right now, price is coming off a selloff but starting to stabilize around the 205–207 area.
This looks like a base forming, but it’s still sitting right under a key resistance zone.
1H Structure - Downtrend Trying to Slow
On the 1H chart, AMZN has been trending lower with consistent
See all editors' picks ideas
Swing Structure Forecast [BOSWaves]Swing Structure Forecast - Statistical Swing Projection System with Volatility-Adaptive Support and Resistance Detection
Overview
Swing Structure Forecast is a statistically-driven swing analysis system that maps directional price structure through confirmed pivot identification, where supp
Pine Script® indicator

TASC 2026.04 A Synthetic Oscillator█ Overview
This script implements a Synthetic Oscillator as presented by John F. Ehlers in the April 2026 TASC Traders' Tips article "Avoiding Whipsaw Trades". The indicator aims to provide a smooth, low-lag oscillator for timely trading signals by dynamically mapping a sine wave to price data
Pine Script® indicator

Volume Spread Analysis IQ [TradingIQ]Hello Traders!
🔹Volume Spread Analysis IQ
This indicator was most voted on for our indicator competition - so here it is! Hope you guys like it :D
Volume Spread Analysis IQ is a chart-reading tool built to help traders judge effort, result, and background context in a way that is visual and
Pine Script® indicator

Market Microstructure AnalyticsThe Hidden Toll on Every Trade
Every time you buy or sell a financial instrument, you pay a cost that never appears on your brokerage statement. It is not a commission. It is not a fee. It is the spread between the price at which someone is willing to sell to you and the price at which someone is
Pine Script® indicator

Fair Value Gap Profile + Rolling POC [BigBeluga]🔵 OVERVIEW
FVG Profile builds a price-level profile based on detected Fair Value Gaps (FVGs) over a fixed lookback period.
Instead of measuring traded volume alone, this tool aggregates bullish and bearish FVG occurrences into horizontal bins, allowing traders to see where price inefficienci
Pine Script® indicator

PineScript integration with Notepad++ (UDL)THIS IS NOT AN INDICATOR!
This is PineScript integration with Notepad++ text editor (NPP). It supports PineScript v6 as of January 2026. Provides autocompletion, function list and syntax highlighting for *.pine files.
Why would anyone need this?
Pine Editor doesn't provide function list yet
Pi
Pine Script® indicator

Machine Learning Pivot Points (KNN) [SS]Hey everyone,
Been working on this one for a very long time.
1. What It Is: The Geometric DNA of a Pivot
Machine Learning Pivot Points (KNN) is a predictive structural tool that moves away from traditional lag based oscillators. Instead of waiting for a moving average crossover, this system t
Pine Script® indicator

Market Structure Volume Profiles [Kioseff Trading]Hello traders and friends!
Introducing: "Market Structure Volume Profiles".
This script combines market structure with volume profiling and CVD to show how volume develops inside each structural changes of the market.
Instead of building one continuous profile across a session, this script create
Pine Script® indicator

Liquidity Thermal Map [BigBeluga]🔵 OVERVIEW
Liquidity Thermal Map visualizes where the highest traded volume has accumulated across price levels over a fixed lookback period.
Instead of plotting classic volume profiles with bars, the indicator builds a horizontal thermal heatmap directly on the chart, highlighting areas of
Pine Script® indicator

VIX Curve Pro - Real-Time Term Structure with StatisticsThis indicator displays the VIX term structure as a spatial curve directly on the chart, allowing you to instantly identify whether the volatility market is in contango or backwardation.
It shows the relationship between different VIX maturities (9D, 30D, 3M, 6M, 1Y) as a single curve.
It also sh
Pine Script® indicator

See all indicators and strategies
Community trends
NIO to $60 - April 1st, It's no joke - 2026Everyone is watching stocks get battered. The geopolitical headlines are relentless, the sentiment awful, and the retail crowd has long since given up. Good. That’s usually when the chart starts doing something interesting.
NIO Inc has corrected over 90% from its all time high. It has spent years i

Buy Side vs Sell Side War. What you need to know.Sell Side Institutions are using retail financial news to spread misinformation, false information and misleading information in an attempt to create panic selling by retail investors and retail traders. Sell Side makes huge profits from acting as Market Makers selling short and then setting a buy t

Tesla - Still heading for new all time highs!👻Tesla ( NASDAQ:TSLA ) still remains bullish:
🔎Analysis summary:
Tesla clearly remains in a very bullish market on the higher timeframe. And with the recent correction of about -25%, it is now approaching a clear support trendline. Therefore it remains totally possible that Tesla is heading f

RIOT: looking for support in short term and a final capitulationRIOT bounced off the support area today, but most likely it is only for a short period. We should expect this to fade fairly soon and keep falling towards $10.4 target area. This could potentially be only the (a) wave of (y) wave of a larger complex correction. Until I see a strong full 5 waves stru

Ideal Strategy for JNJ✅ ENTRY RANGE
Anywhere near current price or on a dip to support.
✅ TARGET
$255–$260 in 3–4 months
(~5–8% gain)
✅ STOP-LOSS (optional)
Below recent swing low
$216–$220
(Very unlikely to hit unless big market shock)
✅ RISK LEVEL
Low
JNJ is one of the most stable stocks you can swing trad

Apple (AAPL) Review — Consolidation Near HighsApple in 2026 is a market defined not by collapse, but by controlled consolidation near historical highs. After a strong rally into early 2026, the stock is now stabilizing as investors reassess valuation, AI expectations, and macro conditions.
Where We Are
Apple is currently trading at $253.79 pe

Coinbase—COIN (1-April 2026)Last time we looked at EMA55 expecting a break of this level as resistance, instead, we saw a rejection. Good news though, we have a higher low.
Last week COIN did a full red candle, this week the action turns green.
Since last time I was a bit too optimistic let's be more cautious this time with

PLTR Sank 40% in 90 Days, Then Bounced. What Its Chart Says NowCybersecurity firm Palantir NASDAQ:PLTR shot up more than 1,300% between its November 2023 low and its November 2025 record high, then pulled back nearly 40% over just three months before rebounding some 15% in the past seven weeks. Let's look at what its chart and fundamentals say might happen ne

IPI – Intrepid Potash | Monthly | The Saucer Is CoilingNearly two decades of base formation. One of the cleanest saucer structures on the NYSE.
From the 2008 commodity peak, NYSE:IPI IPI traced a multi-year declining wedge that resolved into a rounded bottom — the kind of accumulation pattern that only reveals itself on the monthly timeframe. The des

Early Turnaround Opportunity with Margin Recovery UpsideNike, Inc. is currently trading around $47-48, near multi-year lows, despite generating approximately $46.5B in TTM revenue, highlighting a clear disconnect between price and scale.
In the latest quarter, revenue reached $12.4B, slightly up YoY (~+0.6%), indicating early signs of stabilization aft

See all stocks ideas
Today
AYIAcuity Inc.
Actual
—
Estimate
4.05
USD
Today
LNNLindsay Corporation
Actual
—
Estimate
1.70
USD
Today
CCGCheche Group Inc.
Actual
—
Estimate
−0.00
USD
Today
NGENNervGen Pharma Corp.
Actual
—
Estimate
−0.06
USD
Today
PRPOPrecipio, Inc.
Actual
—
Estimate
—
Today
AEHRAehr Test Systems
Actual
—
Estimate
−0.07
USD
Today
APOGApogee Enterprises, Inc.
Actual
—
Estimate
0.88
USD
Today
ANGOAngioDynamics, Inc.
Actual
—
Estimate
−0.11
USD
See more events
Community trends
Bitcoin - 58k soon, then rally 88k! (Best opportunity, must see)Bitcoin has been pretty boring in past weeks, but this should change very soon. I am still expecting a last drop to 58k, but then a huge pump to 88k! Why? First of all, I think Bitcoin has been consolidating in this bearish flag for many weeks, and bearish flags are in general negative patterns for

BTC to $100k. That's exactly why first — $55,000Everyone knows BTC is going to $100k. That's exactly why it goes to $55,000 first
When something is "obvious to everyone" - that's not a buy signal. That's the coordinate where liquidity is parked.
The current market consensus: rotation out of tech giants into real assets, infrastructure, and Bitc

BTCUSDT Compression Near Support - Breakout Above 68K in FocusHello traders! Here’s my technical outlook based on the current BTCUSDT (2H) chart structure. BTC previously traded inside a broad structure, forming a swing high where price reversed and started building a descending channel with lower highs and lower lows, confirming bearish pressure. Currently, B

Bitcoin H4: Macro Pressure Still in ControlHello everyone,
Looking at the H4 chart of Bitcoin, the market is showing a clear rebound from the recent low around 66,000 up to the 67,500–68,000 area. However, when we step back and assess the broader structure, this still appears to be a technical recovery, as price remains below both key EMA
BTCUSDT – Head & Shoulders BreakdownHi!
Market Structure
Price is forming a clear head and shoulders pattern, indicating a potential trend reversal as buying momentum weakens.
Key Resistance
The $76K–$77K zone remains strong resistance where the head was formed.
Current Reaction
Price is retesting the neckline and trendline s

BTCUSDT Short: Rejected at Supply, Downside Toward 67.3KHello traders! Here’s my technical outlook based on the current BTCUSDT (2H) chart structure. BTC previously moved inside a strong ascending channel. After rejection led to a breakdown below the channel support, marking a shift toward a bearish structure.
Currently, price is trading below the 69,4

DOGE Refuses to Break Down — Upside Loading?DOGE Refuses to Break Down — Upside Loading?
For about 2 months, DOGE has been moving within a broader "Range Trading Pattern" with a well-defined support near 0.08800 and resistance at 0.10450.
Doge tested the support area these days and is likely to start the bullish move again from this area c

Solana (SOL) | Not Bottomed Yet – $50 Target + Short SetupSOL has not yet hit its bottom, where ideally we should see a $50 price to be reached where most of the big players would consider buying in.
So, as we are in intense times on the markets thanks to economic news, I would not say that we are yet at the bottom with Solana; there is still room.
The g

Tether Dominance is preparing to crash (USDT.D)A major crash. USDT.D (Tether Dominance) has a combination of multiple bearish signals. One of those "there is no going back scenario." I will add this index to the list of charts supporting a bull-market developing now on Bitcoin and the altcoins.
The main signal supporting a drop on Tether Domina

Bitcoin - April 2026The market is in full panic mode. Why sell at $126k when you can sell $66k? You might think sarcasm but on-chain data suggests many sellers today are selling at a loss. That is the market mindset, buy high sell low backed by facts on Glassnode.
Perhaps sellers are not at fault as Influencers prepa

See all crypto ideas
Corrective Bounce Inside a Larger Bearish RepricingXAUUSD - Corrective Bounce Inside a Larger Bearish Repricing
Gold has staged a decent recovery from the recent liquidation low, but structurally this still looks more like a corrective phase inside a broader bearish repricing than the start of a clean impulsive trend reversal.
The current rebou

XAU/USD | Gold Rebounds Strongly – Key Levels To Watch Next!By analyzing the #Gold chart on the 4H timeframe, we can see that price continued to follow the projected bullish scenario and pushed higher once again after holding the key demand zones discussed in the previous analysis. During today’s session, Gold extended its recovery move and reached the impor

XAUUSD Breakout Loading! Explosive Move Incoming?🚨 Market Situation TVC:GOLD
Gold is currently trading inside a tight compression (triangle structure), with price approaching a key descending resistance trendline.
After multiple higher lows, buyers are slowly building pressure — a classic sign of a potential breakout setup.
💡 Compression = E

XAUUSD Rising Channel Signals Potential Breakout at 4,800Hello traders! Here’s my technical outlook based on the current XAUUSD (1H) chart structure. Gold moved from a descending channel into a range, then shifted into an ascending channel, forming higher lows. Price reclaimed 4,670 support, confirming demand. Currently, price is approaching the 4,800 res

Gold: Manipulation is Being Exposed Even By...Gold: Manipulation is Being Exposed Even By Reputable News Agencies
Over the past two months, gold has fallen twice, by almost 25% each time. As we can see, the correction was very large, seemingly for no apparent reason.
As Reuters reported yesterday:
Profitable bets predicting Trump political

Bullish Continuation Setup After Support Retest – XAU/USD (45M)
🔍 Market Structure
Price action shows a shift from a previously choppy range into a sequence of higher highs and higher lows, confirming bullish momentum. The recent impulsive leg indicates strong buying pressure, likely driven by institutional participation.
🟩 Support Zone (Demand Area)
The hig

Gold Hits Resistance Zone — Correction Incoming?As I expected in the previous idea , Gold( OANDA:XAUUSD ) started rising from the support zone and reached all of its targets (full target).
Currently, Gold is moving near the resistance zone($4,594-$4,690).
From an Elliott Wave theory perspective, it seems that Gold is completing its main wave 4

GOLD: 20-Year Macro Wedge. Is History Repeating?
Gold has been trading within a massive Rising Wedge for two decades. We are now at a critical junction that could define the next few years for the metal.
The 20-Year Pattern ⏳
Since 2006, Gold has been respecting this giant structure. This is a "super-cycle" level analysis that requires patience

GOLD - Consolidation near the trigger. Uptrend and newsFX:XAUUSD is trading near key resistance at 4,735, finding support from a weaker dollar amid hopes for a de-escalation of the conflict in the Middle East
Key factors: Trump did not anticipate this turn of events in the Middle East, shifting responsibility for the strait to NATO countries. Earl

Selena | XAUUSD · 1H – Bullish Channel with Breakout PotentialFOREXCOM:XAUUSD PEPPERSTONE:XAUUSD
After sweeping sell-side liquidity below 4200, price showed a strong bullish reaction and established a base. The market is now moving inside a rising channel, confirming short-term bullish structure. The 4500–4600 zone is acting as a key support area, where p

See all futures ideas
GBPUSD Weekly CLS Model 1New CLS range created and Im looking for Long Model 1 trades setup. As always after the manipulation below the CLS range and reaction from the key level. We need to see confirmation switch from the manipulation phase - CIOD (change in order flow).
⏳ Stay patient and enter only after candle close.

TheGrove | EURJPY Buy | Idea Trading AnalysisEURJPY is moving on Resistance LINE..
The chart is above the support area, which has already become a reversal point twice.
We expect a decline in the channel after testing the current level and moving to resistance line
We expect a decline in the channel after testing the current level
Hello Trade

EURUSDHello Traders! 👋
What are your thoughts on EURUSD?
After a strong bullish move, price has entered a corrective phase, and clear signs of weakness are now visible in the bullish structure. The break of the ascending trendline was the first signal of a shift in market momentum.
Currently, following

USDCAD Breakout and Potential Retrace!Hey Traders, in today's trading session we are monitoring USDCAD for a buying opportunity around 1.38400 zone, USDCAD was trading in a downtrend and successfully managed to break it out. Currently is in a correction phase in which it is approaching the retrace area at 1.38400 support and resistance

EURUSD: Trading in Wedge With Downside Pressure Toward 1.1550Hello everyone, here is my breakdown of the current EURUSD setup.
Market Analysis
EURUSD previously traded inside a downward channel, forming lower highs and confirming sustained bearish pressure. After a breakdown, price entered a range, showing temporary consolidation and liquidity build-up. Fo

GBPUSD reflects a controlled pullbackGBP/USD reflects a controlled pullback within a broader bearish channel, where price has recently reacted strongly from the lower boundary. This reaction suggests that buyers are beginning to step in at key demand levels, creating the potential for a short-term bullish move.
Due to the Upcoming USD

NZDUSD Breaks The Channel – Bullish Reversal Ahead ?NZDUSD Breaks The Channel – Bullish Reversal Ahead ?
NZD/USD has broken out of a well-defined descending channel, signaling a potential shift in short-term market structure.
After a sustained bearish move, price action formed a clear corrective channel before impulsively breaking to the upside.

EUR/USD: Rejection at Resistance? Target 1.1400EUR/USD is hitting a wall. Despite the multi-month Bullish Channel, the local structure is screaming "correction."
The Setup 🧩
Major Structure: Price is currently oscillating within a large ascending channel.
Local Pattern: A Wedge Pattern has formed at the top of the recent swing, pushing price i

USDJPY 30Min Engaged ( Bearish Entry Detected )⚡Base : Hanzo Trading Alpha Algorithm
The algorithm calculates volatility displacement vs liquidity recovery, identifying where probability meets imbalance.
It trades only where precision, volume, and manipulation intersect —only logic.
✈️ Technical Reasons
/ Direction — SHORT / Reversal 158.650
☄

Resistance Rejection – Bearish Pullback SetupPrice showed a strong **bullish impulse**, breaking above previous structure and reaching a key **resistance/supply zone near 1.6100**. After the sharp move up, price started **consolidating under resistance**, indicating weakening bullish momentum.
The inability to break higher suggests a potentia

See all forex ideas
Trade directly on Supercharts through our supported, fully-verified, and user-reviewed brokers.


